Green Tashkent — interactive tree map of Tashkent
For Green Tashkent, we built an interactive tree map of the capital in four languages: mahalla and district layers, search, filters, tree cards and inventory statistics. The map shows over 10,000 points at once and stays smooth at 60 FPS.
Challenge
Green Tashkent is a project to inventory the capital's trees and build a digital tree registry. It is run by the Ministry of Ecology, Environmental Protection and Climate Change, the Tashkent city hokimiyat through its Department of Digital Development, and the Zamin Foundation. Field specialists collect the data, dendrologists verify it, and the map is open to every resident.
Tashkent's digital registry already holds more than a million trees, each with its species, height, trunk thickness, crown diameter, coordinates and a photo. The project needed an interactive tree map that shows this whole dataset, stays fast in the browser and gets a user to a specific tree in seconds.
The data changes every day. Field specialists add new trees, dendrologists verify species, and mahallas move from awaiting inventory to completed. The map and statistics had to show this process honestly: what has been verified, what is still awaiting review and how much each specialist has done.
The map serves different audiences. A resident wants to find a tree by address and report a problem, while journalists and city services compare districts, species and trends over a chosen period. All of it had to work in Uzbek in both Latin and Cyrillic script, in Russian and in English, with a separate mode for visually impaired users.
Some layers do not come from the platform's API. Trees, mahallas and parks are served by the city's GeoServer, so the map had to combine external map services, the platform's own API and several base maps without the user noticing any seams.
Solution
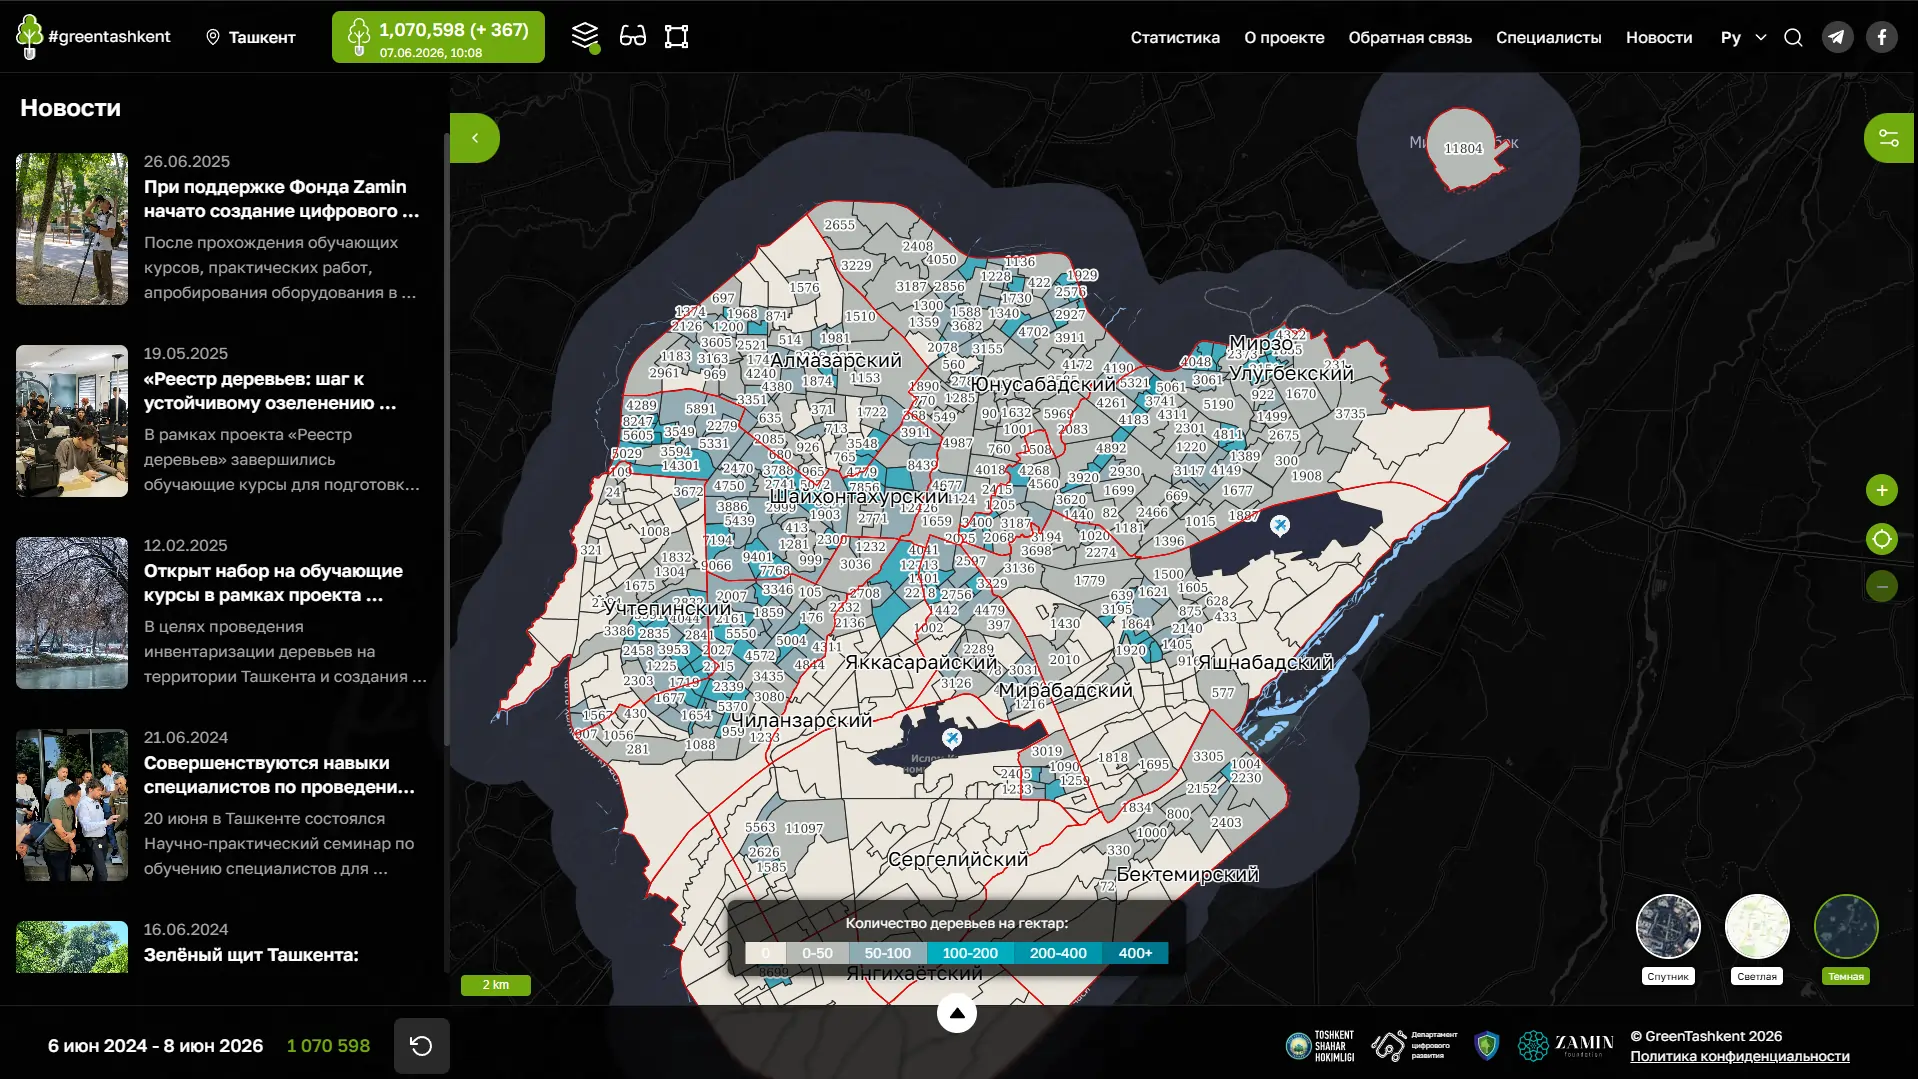
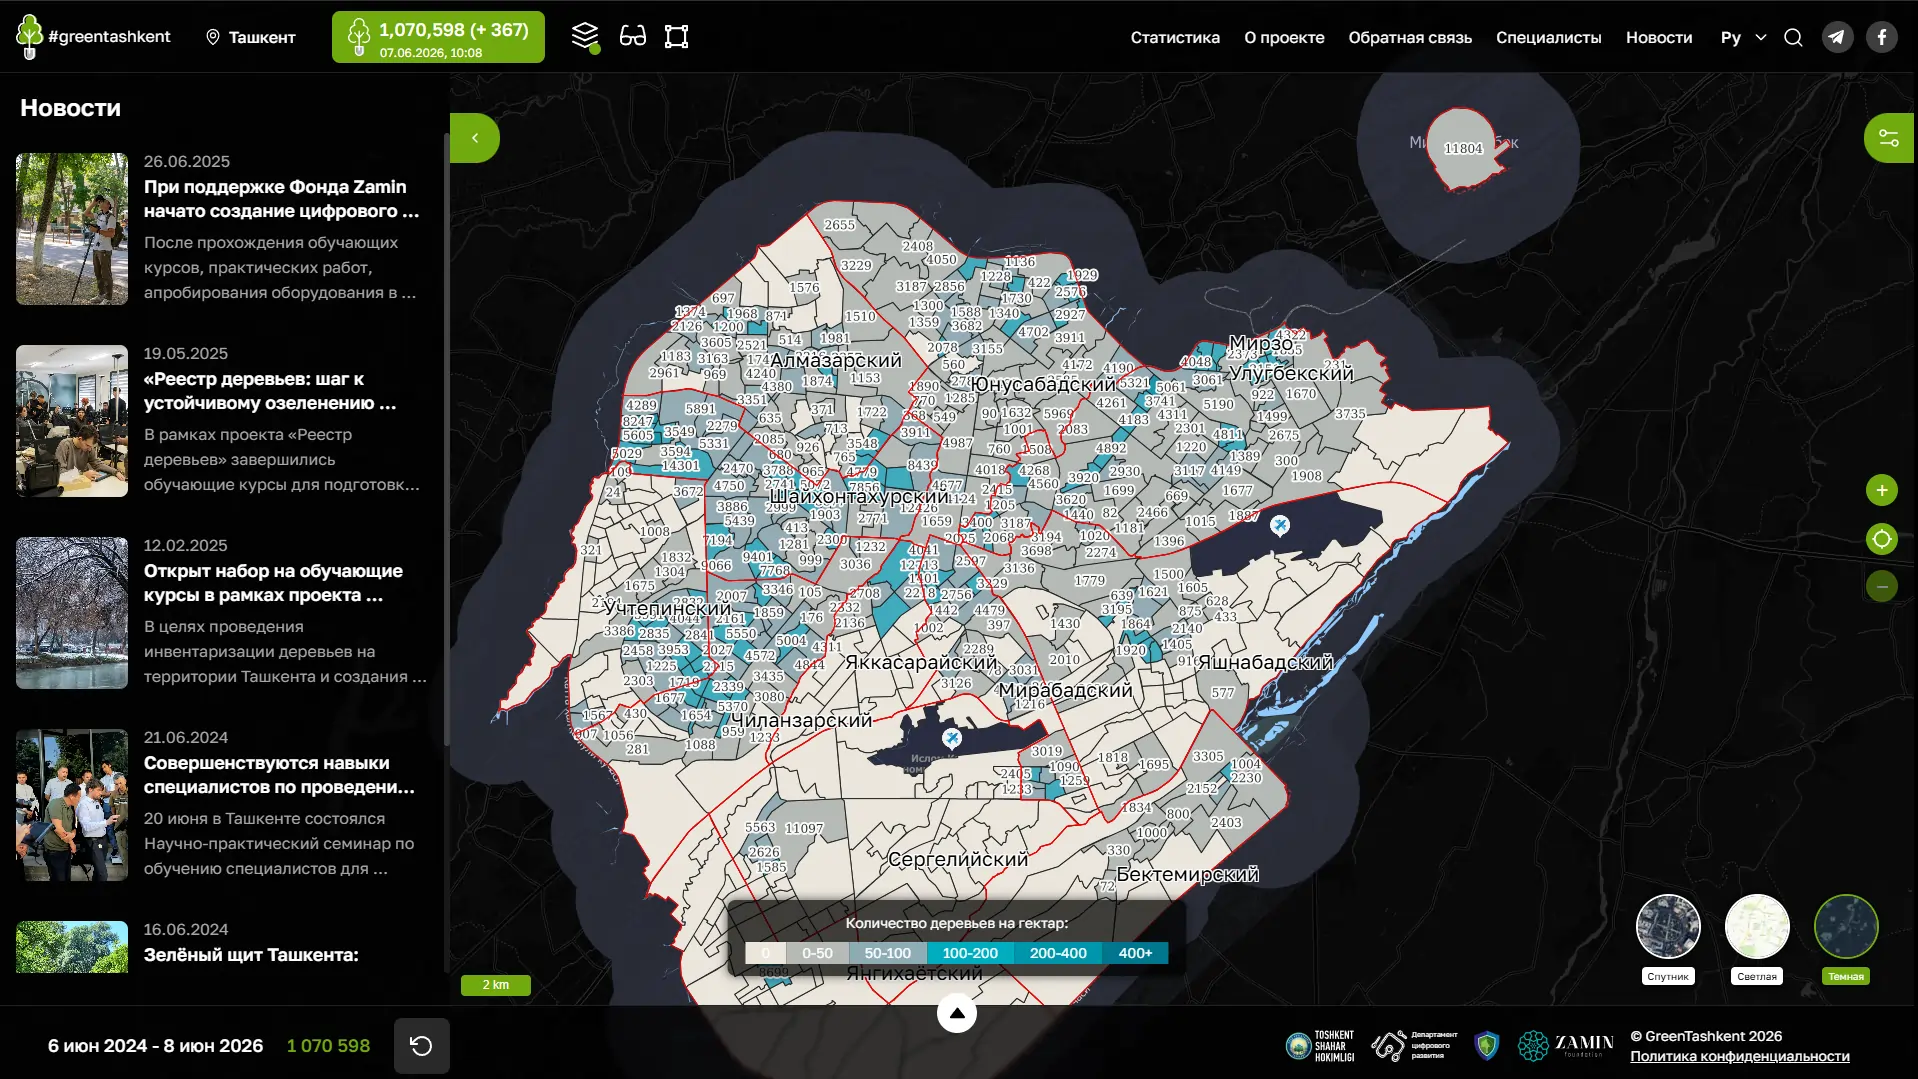
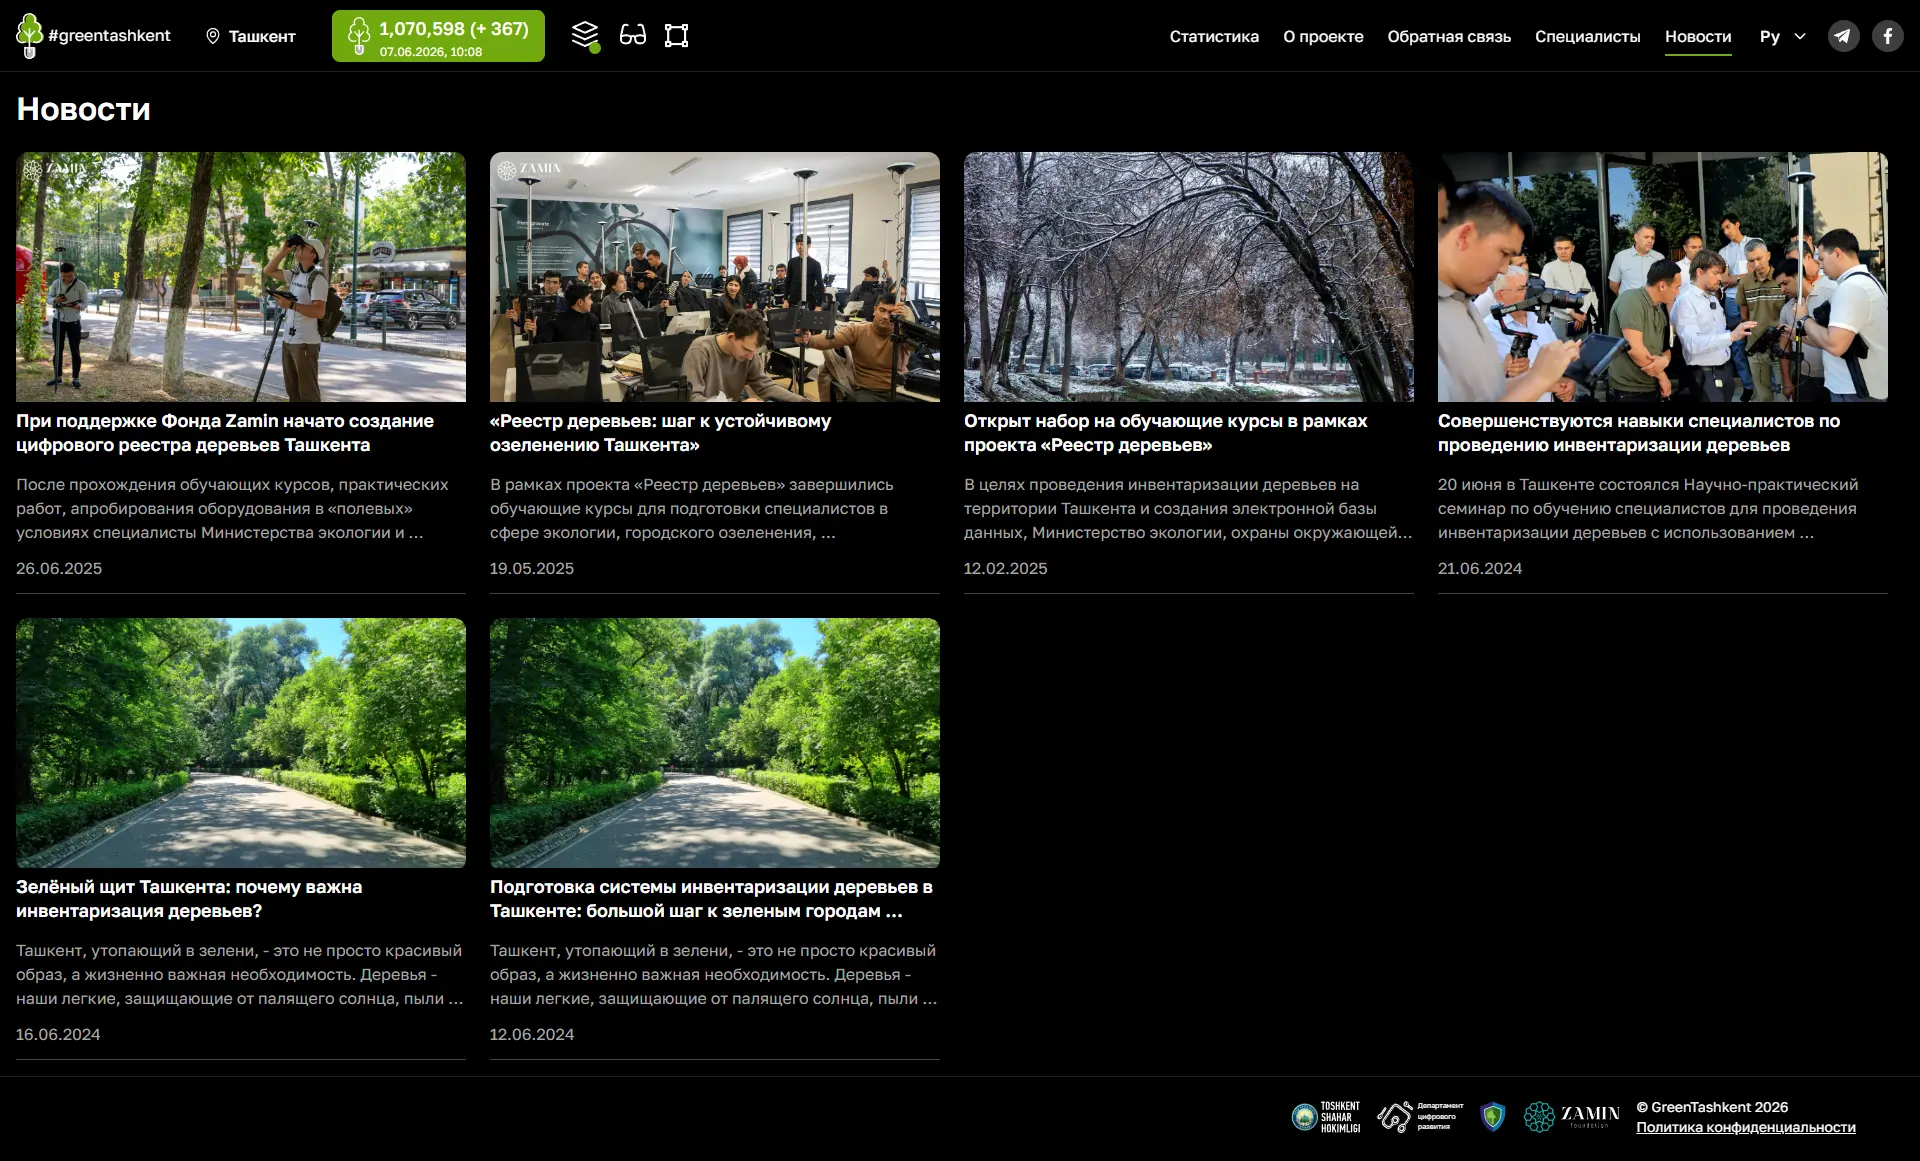
We made the map the main screen. Mahallas are shaded by density, the number of trees per hectare, and layers for districts, parks, NDVI and areas with perennial plantings switch on top, while the base map changes between satellite, light and dark. A period bar with a tree counter runs along the bottom, and project news sits on the left.
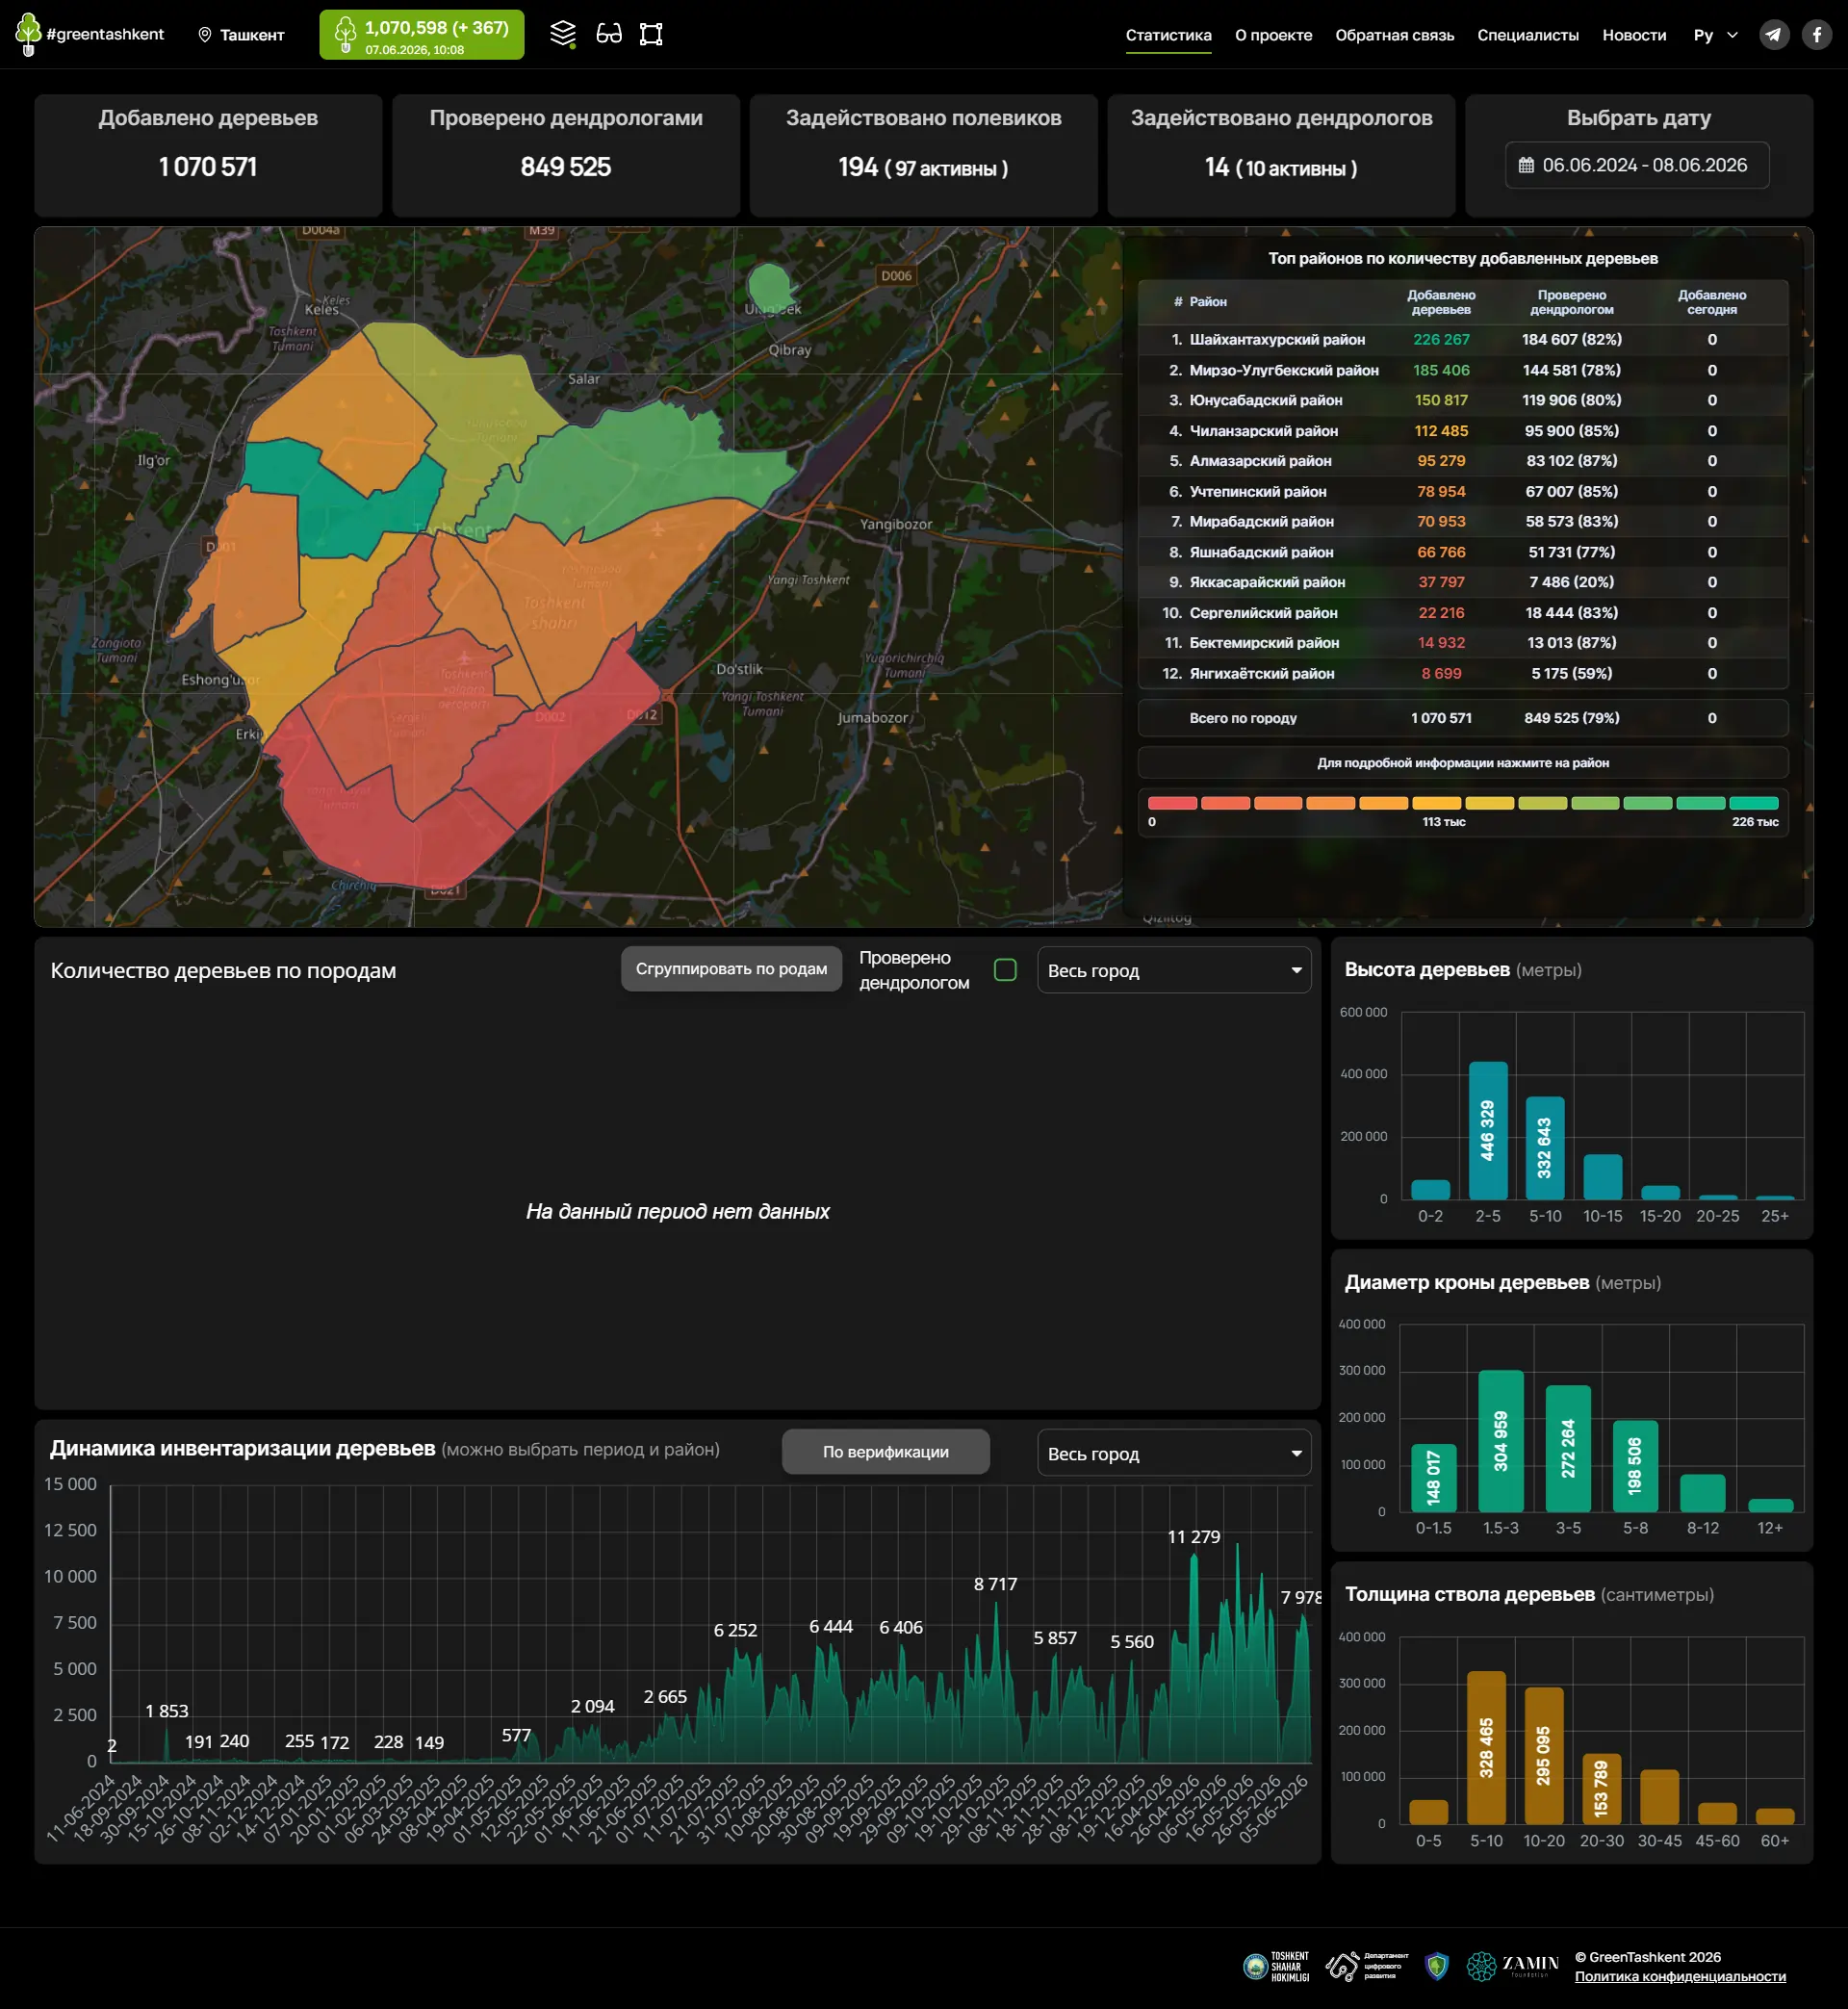
A tree can be found by address, coordinates or ID and filtered by genus and species, height, trunk thickness and crown width. The tree card shows its dimensions, address, coordinates, balance holder, specialist and dendrologist, and a Complain button sends a report. The statistics page brings together counters, a district table, height, crown and trunk distributions and the inventory trend.
The front end is built with React and Vite, using MobX and Leaflet. Tree, mahalla and park layers arrive as tiles from the city's GeoServer, so the heavy rendering stays on the server and the browser receives finished images. Statistics, tree cards and news come from a Django REST Framework API, and Yandex Metrica tracks visits.
Map layers and greening density
Mahallas are coloured by the number of trees per hectare, from empty plots to areas with more than 400. The settings switch on districts, parks, the NDVI index and areas with perennial plantings, adjust district opacity, and show trees, seedlings and bushes separately.
Tree search and filters
Users can search by address, coordinates or tree ID. Filters narrow the map by genus and species, height, trunk thickness and crown width. A measuring tool counts the trees inside a selected area, and the link to any tree can be copied and shared.
Individual tree card
The card lists genus, height, trunk thickness, crown diameter, district, mahalla, address and coordinates, plus the balance holder, the specialist and the dendrologist. The dendrologist review status is visible at once, and the dates added and last updated show how fresh the data is.
Inventory statistics
The statistics page shows how many trees have been added and verified and how many specialists and dendrologists are involved. It also ranks districts, breaks trees down by species, plots height, crown and trunk histograms and draws a trend chart that narrows to a period and district.
Specialists and mahalla progress
The specialist ranking is based on the number of trees added over the whole period, a year, quarter, month, week, yesterday and today. For every mahalla, the platform shows its area, trees per hectare and status: awaiting inventory, in progress, under review or completed.
Feedback and accessibility
Residents write in through a feedback form that accepts coordinates, can detect their location and takes up to five photos. A separate mode with a larger font serves visually impaired users, and the interface switches between Uzbek in Latin and Cyrillic, Russian and English.
Results
The project's key outcomes in numbers.
- 10k+Points on the map
The map holds more than ten thousand points in view at once without losing responsiveness.
- 60 FPSMap smoothness
Panning and zooming stay fluid because the layers arrive as ready-made tiles.
- 4Platform languages
Uzbek in Latin and Cyrillic script, Russian and English for residents and visitors.
- 5Map layers
Mahallas, districts, parks, the NDVI index and the general tree layer switch on in the map settings.
Design & interfaces
Key screens and interfaces of the project.
Project tech stack
The stack we used to build the solution for the client's task.
- Yandex Metrica
- Python
- Django
- Django REST Framework
- Nginx
- React
- Vite
Similar cases


Ready to become the next case?
Tell us about your task — a manager will assemble the team, calculate the estimate and send a proposal within the first hour after the request. No obligations, no drip campaigns.