School Tashkent — school data and testing platform
For the Tashkent city administration, we built a school data platform: buildings, students, teachers and attendance across every district, plus online testing for students and teachers. It covers 120+ schools, and reports now take 70% less time.

Challenge
School Tashkent is the platform the Tashkent hokimiyat (city administration) uses to oversee schools in all twelve districts. It brings together data on buildings and infrastructure, students, teachers, attendance and graduates, along with test results. Access to each section depends on the user's role.
More than a hundred schools, twelve districts and hundreds of thousands of students, yet the information about them lived in scattered spreadsheets and reports. Capacity, building condition, repairs, vacant teaching posts, students under internal monitoring: every figure had to be collected separately. The city needed a school data platform that shows any school or district on a single screen.
Reports were compiled by hand. Answering a simple question, such as where teachers are short, which school needs repairs or how attendance is changing, meant pulling numbers together from several sources. That work was repeated for every new report and took time that could have gone into decisions.
Knowledge testing also had to move into the system entirely. Tests for students and teachers needed automatic marking, and the results had to be comparable across classes, subjects, schools and districts. Paper answer sheets and manual scoring cannot give that comparability, and counting errors are inevitable.
Security and simplicity were a requirement of their own. The platform stores data about children and staff, so sign-in and access rights had to be strict, while the interface had to stay clear for people without a technical background. The system also had to work in Russian, Uzbek and English.
Solution
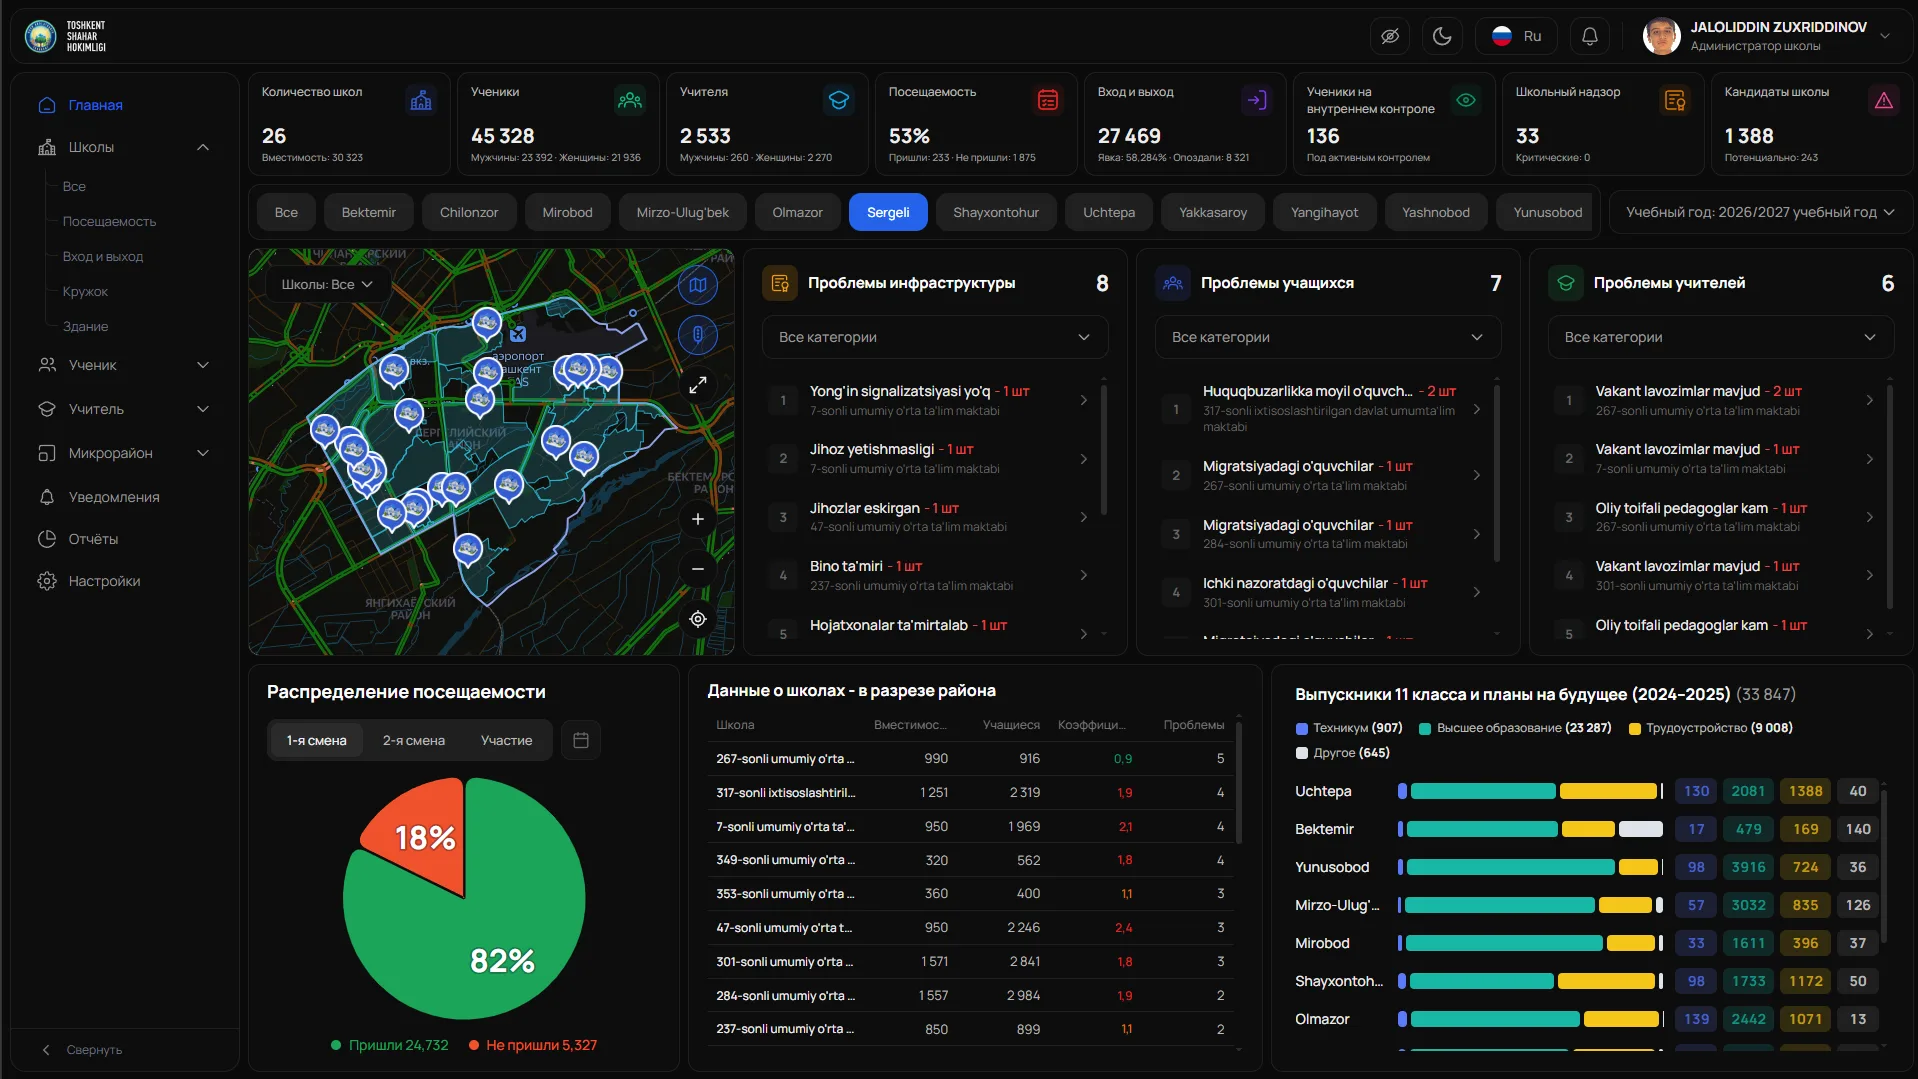
We built the platform on two levels: the city and the individual school. The home screen opens with a summary of schools and places, students, teachers, attendance, entries and exits, internal monitoring and school supervision. District tabs and an academic year selector rebuild every figure, and the map marks the schools of the chosen district.
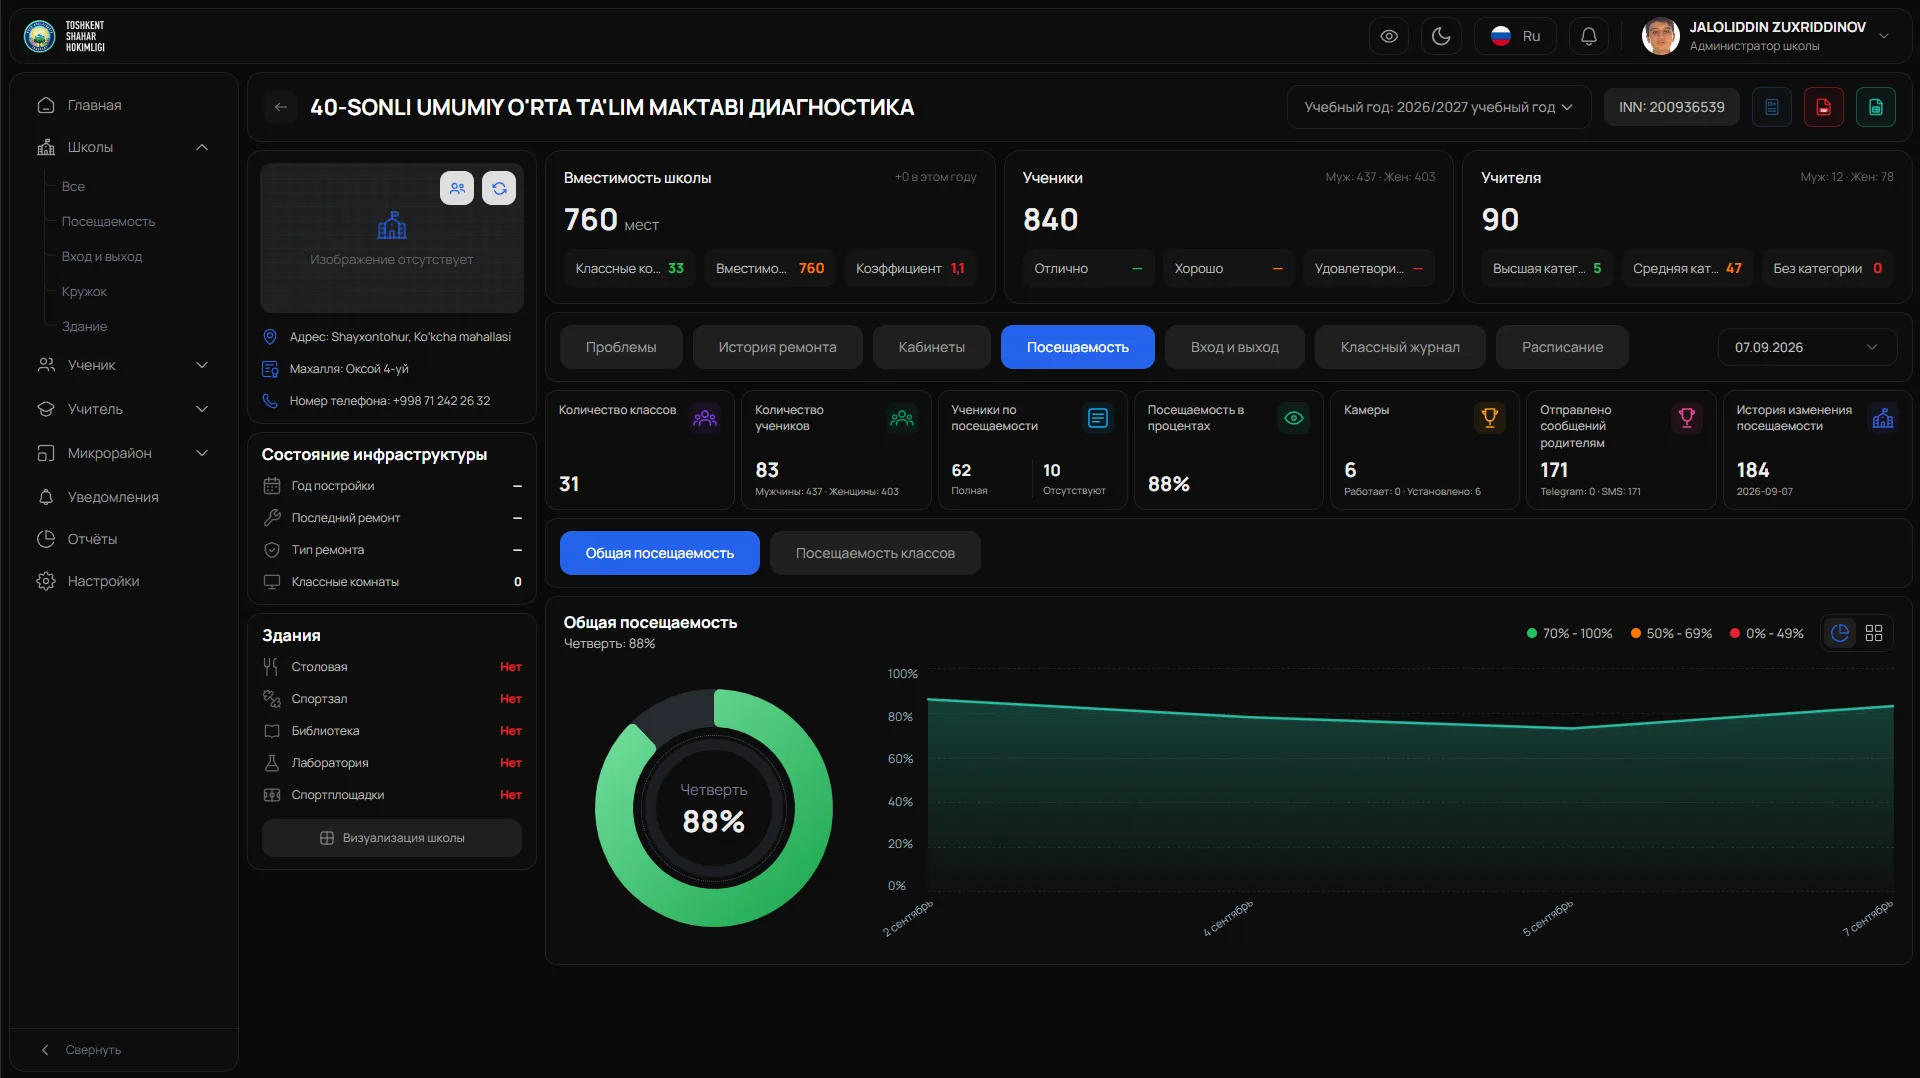
From the summary, an administrator moves into a school card: capacity, students and teachers by category, building condition, repair history, classrooms, the class register and the timetable. A school report exports to PDF and Excel. Students and teachers take tests right in the system, and the results go straight to the Education Quality section.
Under the hood it is a single-page application built with React and Vite, with MobX for state: sections load on demand, and the interface offers dark and light themes and three languages. Users sign in with an SMS code, through OneID or with a QR code, and interface errors are collected in Sentry so failures surface immediately.
City and district overview
The top panel gathers the key figures: schools and places, students and teachers, attendance, entries and exits, internal monitoring. Tabs for the twelve districts and the academic year rebuild every widget, the map shows the district's schools, and a separate chart tracks where grade 11 graduates go next.
A card for every school
Each school gets a diagnostic card: address, mahalla, tax ID, capacity and occupancy ratio, students by performance and teachers by category. Next to it sit the year of construction and the last repair, plus whether the school has a canteen, gym, library, laboratory and sports grounds.
School issues under control
Issues are split into three lists: infrastructure, students and teachers. A missing fire alarm, worn-out equipment, vacant posts, students under internal monitoring: each entry is tied to a specific school and can be filtered by category.
Attendance by district and shift
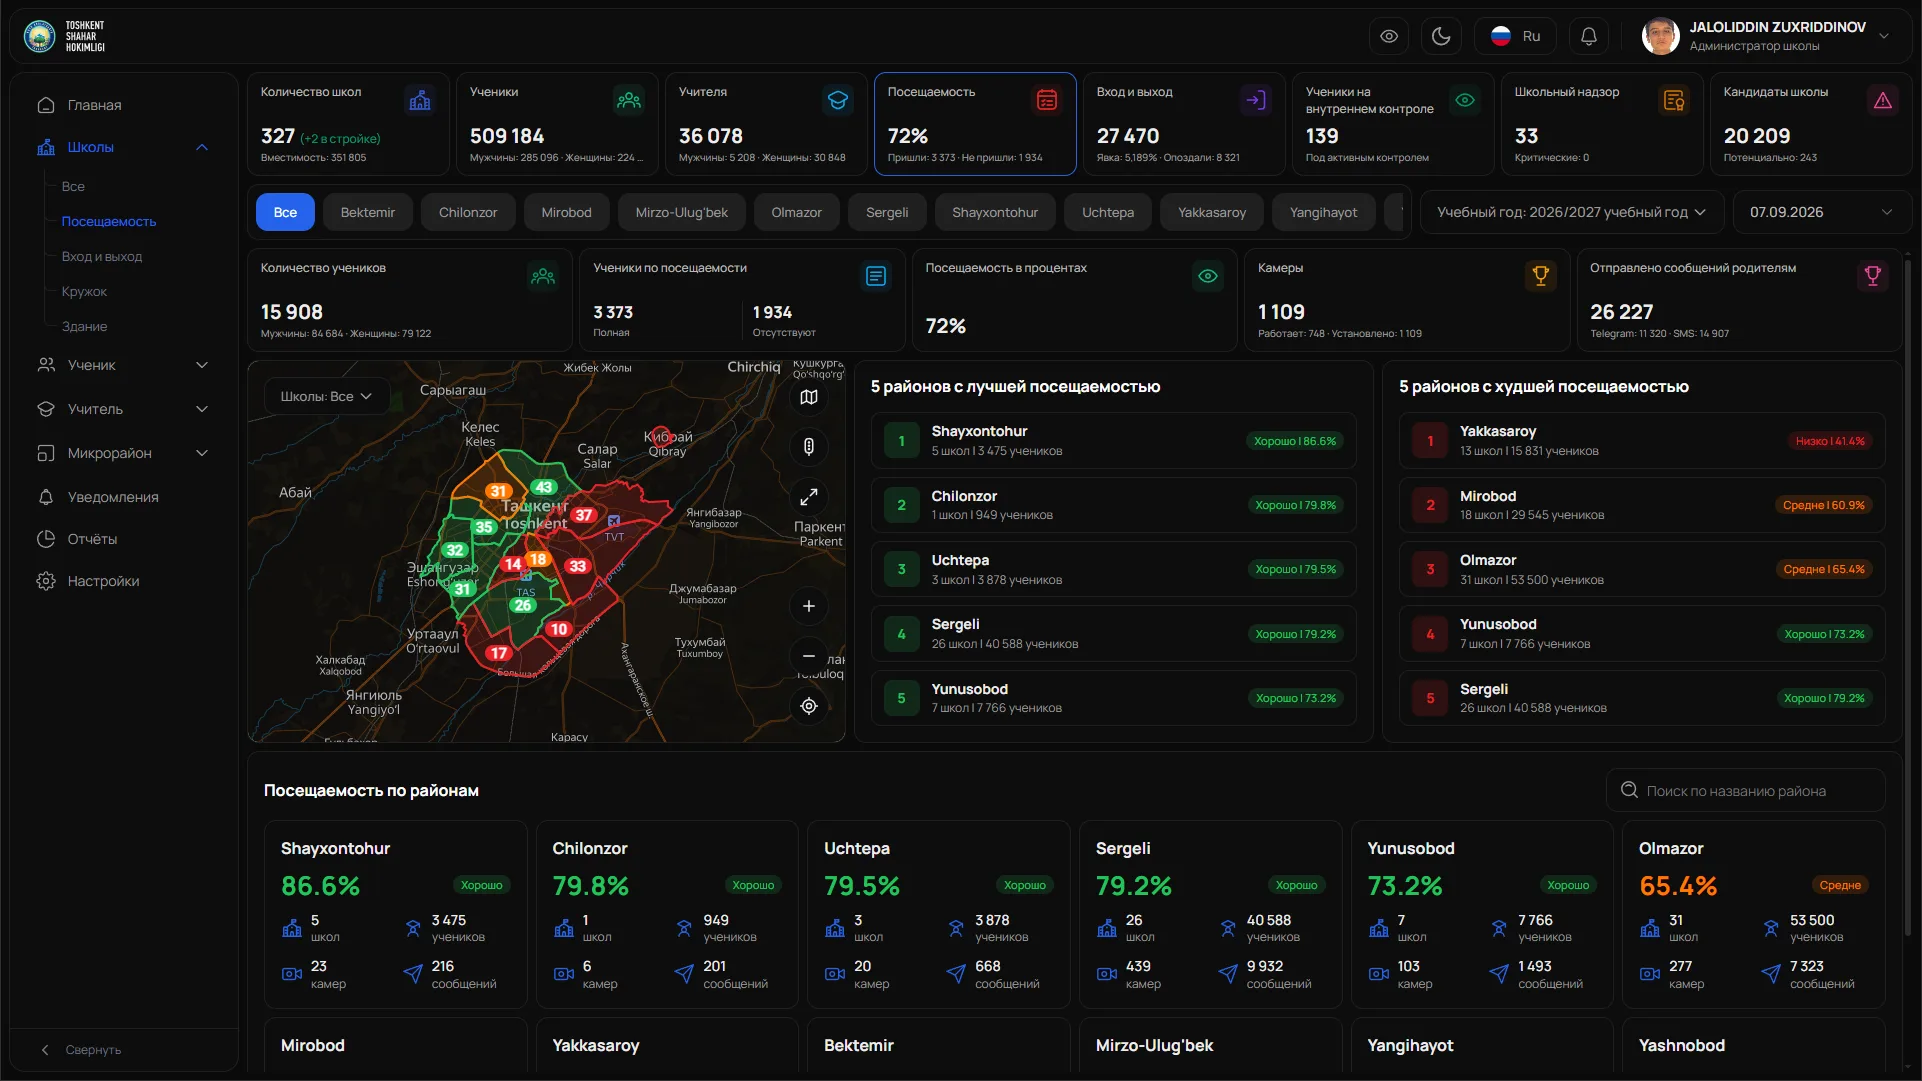
The attendance screen shows the share of students present in each shift, the five districts with the best and worst figures, and cards for every district. It also shows how many cameras are working in schools and how many notifications went to parents via Telegram and SMS.
Online testing for students and teachers
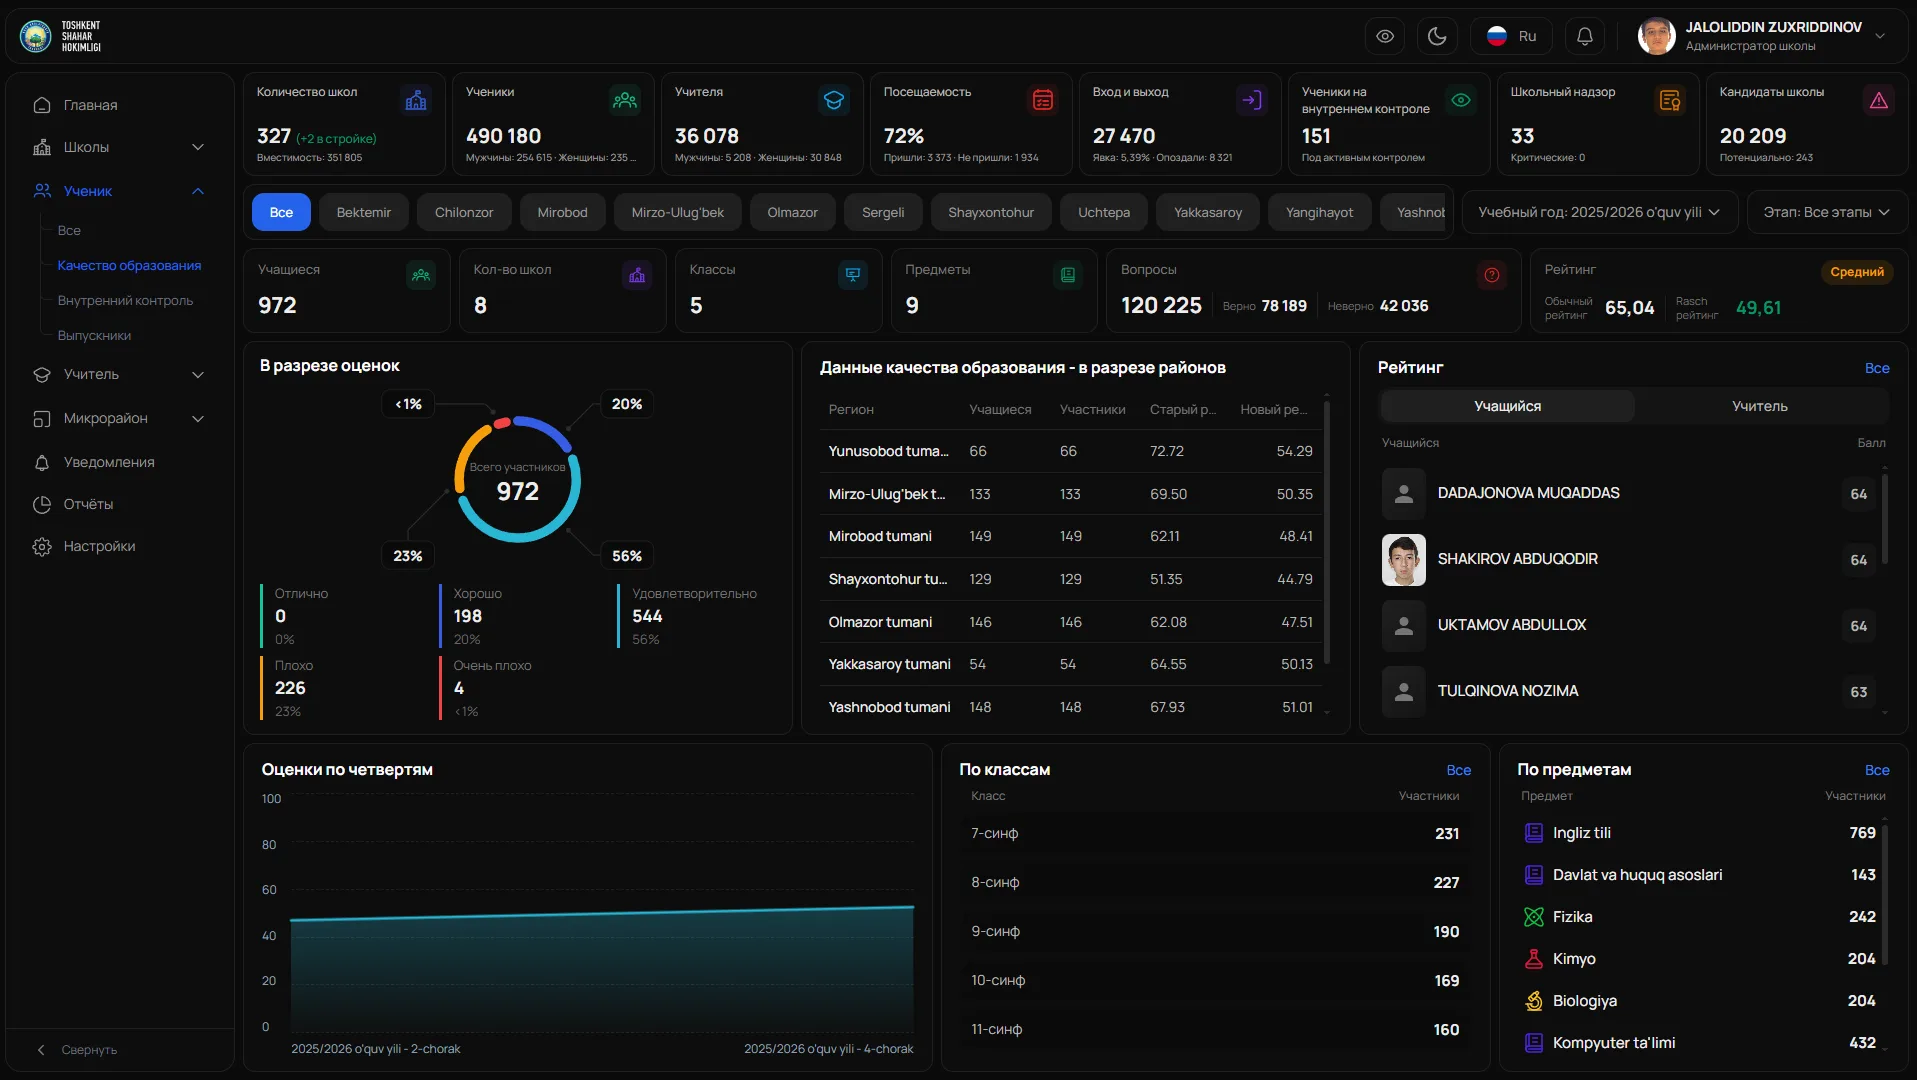
Tests run right in the system: answers are marked automatically, and results are available by student, class, school and district. Besides the raw score, the platform calculates a Rasch model rating, which takes item difficulty into account rather than just the number of correct answers.
Education quality analytics
The section shows the grade distribution, a comparison of districts by old and new ratings, grades by term, and participation by class from grade 7 to grade 11 and by subject. Student and teacher rankings are built automatically, with no manual spreadsheet work.
Results
The project's key outcomes in numbers.
- 120+Schools in the system
Data on more than 120 schools sits on one platform instead of scattered spreadsheets.
- −70%Time spent on reports
Summaries and exports are generated automatically, so reports take far less time to prepare.
- 100%Testing online
Students and teachers take tests only in the system, with no paper answer sheets or manual scoring.
- 12Tashkent districts
The platform covers every district of the city, from Bektemir and Sergeli to Yunusobod and Yashnobod.
Design & interfaces
Key screens and interfaces of the project.
Project tech stack
The stack we used to build the solution for the client's task.
- Nginx
- React
- Vite
Ready to become the next case?
Tell us about your task — a manager will assemble the team, calculate the estimate and send a proposal within the first hour after the request. No obligations, no drip campaigns.